
Football Prediction Models: xG Data & League ROI Analytics
 Available in US
 Available in US
Football is beautifully unpredictable, which is exactly what makes it both frustrating and fascinating for bettors. A single deflection changes everything. A refereeing decision that goes either way swings the entire result. The underdog parks the bus for ninety minutes and nicks a goal on the counter. This variance is precisely why casual prediction methods fail so consistently they’re trying to impose certainty on a sport that fundamentally resists it.
The bettor who treats football like a puzzle with a definite solution will go broke chasing patterns that don’t exist. The one who embraces uncertainty while searching for small probabilistic edges can find consistent value. The difference comes down to accepting that you’re never predicting what will happen, only what’s most likely to happen and whether the odds reflect that likelihood fairly.
Football prediction has evolved dramatically over the past decade thanks to expected goals models, granular tracking data, and better understanding of which metrics actually predict future results versus which just describe past outcomes. The surface-level analysis that worked when bookmakers were setting lines manually doesn’t cut it anymore. But here’s the good news: while prediction has gotten more sophisticated, the tools and data have become accessible to anyone willing to learn.
This isn’t about memorizing formations or becoming a tactical genius. It’s about understanding which factors genuinely influence match outcomes, how to quantify them properly, and where bookmakers systematically misprice markets because they’re accounting for public bias rather than true probability. Get these fundamentals right, and football becomes one of the more profitable sports for long-term betting despite its inherent unpredictability.
xG Model Efficiency: Predicting Football Outliers in 2026
Football statistics are everywhere, but most of them are useless for prediction. Possession percentage might be the single most overrated metric in sports betting. Teams can dominate the ball while creating nothing dangerous, or they can sit deep with thirty percent possession and generate the game’s only clear chances through efficient counter-attacks.
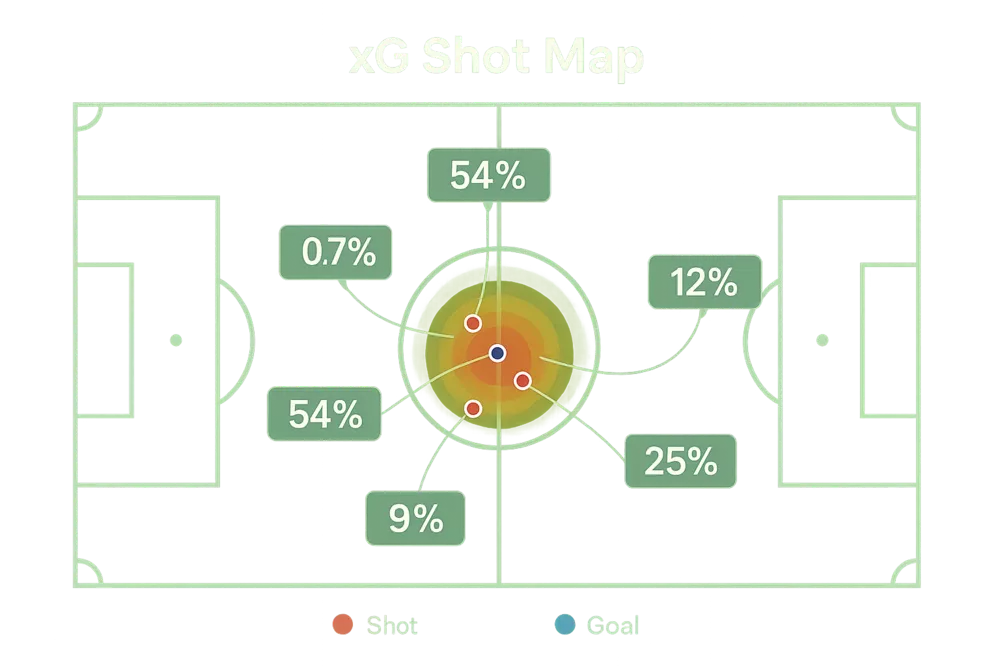
Expected goals changed everything by separating shot quantity from shot quality. A team with fifteen shots sounds dominant until xG reveals they were all speculative efforts from distance with defenders in the way. Meanwhile, their opponents had five shots totaling higher xG because they came from dangerous positions after good buildup. The scoreline might say 1-0 either way through random variance, but xG tells you which team actually created more danger and is likely to perform better over repeated matches.
The calculation behind xG is straightforward in concept: every shot has a historical conversion rate based on its location, angle, defensive pressure, and how the chance was created. Assign those probabilities to each shot in a match, sum them up, and you’ve got expected goals. A shot from six yards out in the center of the goal with no defenders nearby might be worth 0.7 xG because historically those shots score seventy percent of the time. A speculative effort from thirty yards is worth 0.03 xG.
What makes xG valuable for bettors is that it’s more stable than actual goals over small samples. A team might score four goals from 1.2 xG through exceptional finishing or goalkeeper errors, but that’s unsustainable. Another team creates 2.5 xG but only scores once through poor finishing or excellent goalkeeping. Over time, goals regress toward xG as luck evens out. Teams consistently outperforming their xG are candidates to fade, while teams underperforming it present potential value.
Shot location data supplements xG by showing where a team generates chances. Two teams might have similar xG totals, but one creates chances from wide areas while the other generates central opportunities. The tactical matchup matters a team strong at defending central areas but vulnerable wide faces different threats than one with the opposite profile. These nuances don’t show up in overall xG but influence specific matchup predictions.
Defensive metrics beyond just goals conceded reveal sustainability. A defense allowing 0.5 goals per game sounds excellent until you see they’re allowing 1.8 xG against per game. They’ve gotten lucky with poor finishing from opponents or outstanding goalkeeping. Regression is coming. Conversely, a defense conceding 1.2 goals per game but allowing only 0.9 xG against is suffering from bad luck and likely to improve.
Possession-adjusted statistics provide better context than raw numbers. A team might have fewer shots than their opponents, but if those shots came from higher quality positions and they dominated the territorial battle, the raw shot count misleads. xG per possession or shots per minute of attacking possession paint a clearer picture than totals that don’t account for how much of the ball each team had.
Set piece strength matters enormously and gets undervalued by casual bettors. Teams strong at defending set pieces but weak in open play have a profile that confounds simple goal-based analysis. Their overall defensive record might look okay despite poor open-play defending because they limit set piece damage. Opponents who don’t generate many set pieces might find more success than expected.
The key is building a mental model of team quality that looks through results to underlying performance. That team won their last three matches, but xG data shows they created little while benefiting from opponent wastefulness and a few wonder goals. They’re not suddenly excellent they’re riding variance that’s temporary. The team that lost their last two but posted strong xG numbers in both matches is potentially undervalued by a market overreacting to results.
Match Winner Predictions: Getting the Basics Right
Predicting match winners in football is simultaneously the most obvious market and one of the hardest to find consistent value in. The challenge is that bookmakers spend immense resources getting these lines accurate because they attract the most volume. Your edge needs to come from information they’re underweighting or biases in how they shade odds to balance their books.
Current form analysis goes beyond just looking at recent results. Three straight wins mean nothing if the opponent quality was terrible and the underlying performance mediocre. What you need is form against similar opposition, ideally adjusted for home and away splits. A team demolishing relegation candidates at home tells you little about how they’ll perform away to a mid-table side.
The recency weighting matters too. What happened last week predicts better than what happened two months ago because fitness, form, and tactical setups evolve. But three matches is noise while ten matches starts approaching signal. The balance is giving recent performances appropriate weight without overreacting to small samples that could be pure variance.
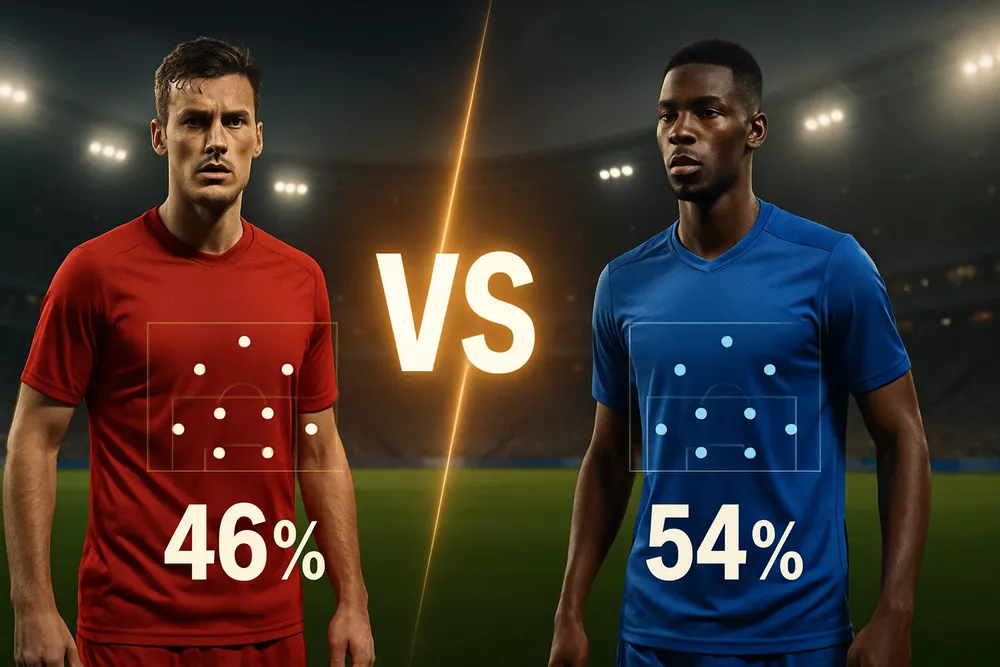
Home advantage quantification varies by league and has changed over time. Pre-pandemic, home teams in the English Premier League won roughly forty-six percent of matches with away teams at twenty-nine percent and draws at twenty-five percent. During empty stadium matches, home advantage shrank measurably. With crowds back, it’s recovered but perhaps not fully to historical levels. Understanding the typical home advantage in your target league establishes baseline expectations that bookmaker odds should reflect.
Certain teams have home advantages larger than the league average. Hostile atmospheres, difficult travel, altitude, pitch dimensions that suit the home team’s style these factors create outsized home advantages that bookmakers sometimes underprice. Similarly, some teams are excellent travelers who perform nearly as well away as home, making them value when the market overcompensates for home advantage.
Motivation factors walk the line between real predictive value and narrative nonsense. Derby matches genuinely matter more to players and produce different tactical approaches, but does that extra motivation overcome a significant talent gap? A team fighting relegation has everything to play for, but does desperation translate to better performance or does pressure cause them to tighten up?
The honest assessment is that motivation effects are real but inconsistent and hard to quantify. Use them as tiebreakers when other factors are closely balanced, not as primary decision drivers. The relegation-threatened team might show fighting spirit, or they might collapse under pressure. You can’t predict which with confidence, so weight more reliable factors like underlying performance metrics more heavily.
Managerial changes create temporary disruptions that markets often misprice. The “new manager bounce” is real in the data teams often improve immediately after a managerial change regardless of whether the new manager is actually better. The reason is psychological: players raise their effort levels to prove themselves to the new boss, and simple tactical changes can unlock different performances. This bounce is temporary, usually lasting five to ten matches before regression toward the team’s true quality level.
The other side is that teams in managerial turmoil before the change often underperform their talent level. Once you see signs that a manager is losing the dressing room or that the board is preparing to sack them, that team might be systematically overvalued by markets that don’t adjust quickly enough for the dysfunction. The trick is identifying the tipping point early rather than waiting until it’s obvious to everyone.
Tactical matchups don’t show up in statistics but can determine outcomes. A possession-based team that progresses through patient buildup might struggle against opponents who sit deep and compact, forcing them to break down organized defenses. That same possession team could dominate an aggressive pressing team that leaves space to exploit. Your statistical model won’t capture this, which is where sport-specific knowledge complements quantitative analysis.
Rest and fixture congestion hit football harder than some bettors realize. A team playing their third match in seven days faces measurably higher injury risk and reduced performance, particularly in the second half as fatigue accumulates. Teams with European commitments midweek often underperform in their following domestic league match. The effect isn’t enormous maybe worth a quarter goal in xG terms but it’s real and markets don’t always price it fully.
Goals Markets: Finding Value in Totals
Goals markets offer more predictable opportunities than match winners because you’re forecasting a specific outcome range rather than picking between three results. The variance is still substantial football’s low scoring ensures that but the analysis framework is cleaner.
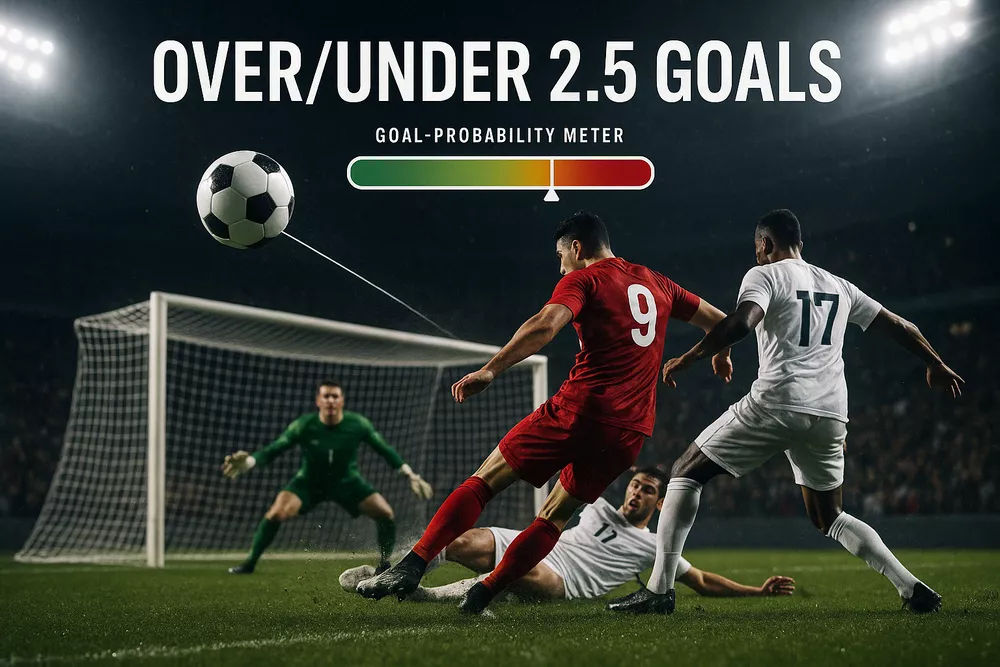
Over-under markets center around 2.5 goals in most matches, though the line shifts to 1.5, 3.5, or other values depending on expected scoring. The beautiful simplicity is that you’re not picking a winner you’re assessing whether the combined attacking quality and defensive weakness suggests more or less than the line.
Team style matchups create the clearest over-under edges. Two attack-minded teams with shaky defenses facing each other generates high-scoring potential. Both managers prefer attacking football, neither prioritizes defensive solidity, and the tactical setup creates space for both sides. These matches regularly hit three or four goals even when the teams aren’t individually prolific scorers.
Conversely, two defensively organized teams with patient attacking approaches produces low-scoring affairs. Neither wants to open up and leave space. The tactical battle becomes about not conceding rather than aggressive attacking. These matches frequently end 1-0 or 0-0 regardless of team quality.
The common mistake is looking at season-long goal averages without considering opponent-specific matchups. That team averages 2.5 goals per game, so overs look good. But they scored most of those goals against weak defenses and now face an elite defensive unit. Their expected goals will be far below season average in this specific matchup. You need matchup-adjusted predictions, not raw averages.
Expected goals projections for both teams provide your baseline. Calculate each team’s xG based on their attacking quality against this specific opponent’s defensive quality. Add them together and you’ve got an expected goal total for the match. Compare that to the bookmaker’s line, and you can identify value.
The over-under decision then becomes probabilistic. If your expected total is 2.8 goals and the line is 2.5, the over has value assuming your model is calibrated correctly. But remember that football goals follow a distribution 2.8 expected doesn’t mean every match lands near there. Some matches produce five goals, others produce zero, but the average across many such matches is 2.8. You need the odds to compensate for that variance.
Both teams to score markets appeal to bettors because they feel more predictable than exact totals. Either both teams score or they don’t simple. The analysis centers on whether each team is likely to find the net rather than predicting exact goal totals. Teams with strong attacks but defensive issues are prime BTTS candidates because they score regularly and concede regularly.
Clean sheet probability for each team is the inverse calculation. A team with an elite defense facing weak opposition has a significant clean sheet chance, making the BTTS “no” option potentially valuable. The market often overvalues BTTS “yes” because casual bettors prefer the excitement of both teams scoring, creating occasional value on the negative.
Historical scoring patterns matter but require proper context. A team that’s scored in fifteen consecutive matches sounds like a lock for BTTS. But what’s their xG been recently? Have they been clinical with limited chances or creating sustained quality opportunities? If it’s the former, regression is coming and that streak will end. If it’s the latter, the streak reflects underlying quality that’s sustainable.
First-half markets present different dynamics than full-match markets. Many teams start cautiously, feeling out opponents before opening up after halftime. First-half under 0.5 or 1.5 goals can offer value in matches between cautious teams. Conversely, aggressive teams that press high from kickoff might produce first-half goals more reliably, making first-half overs attractive despite lower full-match scoring.
The timing of goals within matches isn’t random. Teams trailing late often throw caution away and push for equalizers, creating space for counterattacks. This produces late goals at higher rates than the match flow would suggest. Live betting opportunities emerge from understanding these patterns, but that’s a separate analysis from pre-match prediction.
Advanced Football Markets and Props

Beyond match winners and goals totals lie dozens of niche markets where bookmaker pricing is less efficient because they attract less sophisticated money. These markets reward deeper analysis but require understanding what actually predicts each specific outcome.
Asian handicap markets eliminate the draw by giving one team a goal advantage or deficit that they must overcome. A -1.5 handicap means the team must win by two or more goals for the bet to succeed. These markets appeal to serious bettors because they offer better odds than traditional markets by removing the draw possibility.
The value in Asian handicaps comes from reducing variance. If you think a team will win but you’re uncertain whether it’ll be close or comfortable, the -0.5 handicap (they just need to win) offers better odds than the 1X2 market’s win option. You’re trading potential payout for reduced risk, which makes sense when your edge is in identifying the winner but not the margin.
Correct score predictions are lottery tickets that occasionally pay off dramatically but are extremely difficult to predict consistently. The variance is enormous there are dozens of possible score lines and no amount of analysis makes one specific score probable. Expected goals helps by identifying the most likely score ranges, but even then the prediction is more art than science.
The approach that works is identifying matches where one or two score lines have substantially higher probability than the market suggests. Maybe a strong defensive team playing conservative opposition produces 1-0 results far more often than randomness would suggest. If bookmaker odds on 1-0 imply fifteen percent probability but your analysis suggests twenty-five percent, that’s significant value despite the outcome being unlikely.
Corner markets have become increasingly popular as bettors search for edges in alternative markets. Corners correlate with possession and attacking intent but not perfectly. A team can dominate possession without winning many corners if they’re patient in buildup. Another team might generate corners through aggressive wing play despite equal possession.
Team style drives corner totals. Teams that cross frequently and attack wide areas win more corners. Teams playing through the middle or counter-attacking win fewer. Historical corner data combined with tactical understanding identifies teams likely to exceed or fall short of corner lines. The market is less efficient here than goals markets because fewer sophisticated bettors focus on corners, creating occasional value.
Card markets depend heavily on referee tendencies and match importance. Some referees show cards freely while others let matches flow physically. Derby matches and matches between teams fighting for crucial points produce more cards than meaningless end-of-season fixtures. Tournament knockout matches generate more cards than group stage games because the stakes raise intensity.
The predictive model needs historical card data for teams, referee card averages, and match importance factors. A lenient referee overseeing a low-stakes match between disciplined teams suggests under on cards. A strict referee in a heated derby suggests over. These edges exist because bookmakers set card lines somewhat generically rather than adjusting fully for referee and context.
Player props in football center on goal scorers and performance markets. Anytime goal scorer bets require analyzing striker form, opposition defensive quality, and how matches are likely to unfold tactically. A striker might be prolific overall but face a defensive matchup where chances will be limited. Conversely, a moderate scorer facing a terrible defense with his team heavily favored could be undervalued.
Shot and shot-on-target props for players have emerged with better tracking data. Attacking players for teams expected to dominate possession might exceed their shot props even if goals don’t come. These markets are less efficient than goal markets because fewer bettors analyze them deeply, but they require understanding not just player quality but team tactics and match dynamics.
The danger in alternative markets is overcomplicating analysis. You don’t need to bet every market. Focus on one or two alternative markets where you’ve identified genuine edges through systematic analysis. Spreading thin across ten different prop markets because they exist doesn’t beat mastering one or two where you’ve developed real expertise.
League-Specific Characteristics and Adjustments
Football isn’t a monolithic sport each league has characteristics that influence how matches unfold and therefore how you should approach predictions. What works for the Premier League might fail in Serie A because the tactical cultures and playing styles differ fundamentally.
The English Premier League is characterized by high pace, physical intensity, and less tactical rigidity than some European leagues. Teams across the table attack more aggressively than their counterparts in more conservative leagues. This produces higher-scoring matches on average and more variance in individual results. The quality gap between top and bottom teams is substantial but not insurmountable upsets happen regularly.
Prediction adjustments for the Premier League include accounting for its pace when projecting goals. An xG model calibrated on slower leagues might underestimate Premier League scoring. The physicality means referee decisions and card markets behave differently than in leagues where contact is more restricted. Home advantage is strong in the Premier League, but the best teams increasingly dominate both home and away.
La Liga traditionally emphasized possession and technical quality with more patient build-up play. The top teams dominate possession statistics far more than in the Premier League. This creates different tactical dynamics many matches involve one team controlling seventy percent possession while the opponent defends deep and counters. These matches can produce either high or low scoring depending on whether the dominant team can break down the defense.
Spanish football’s traditional low-scoring tendency has shifted somewhat as tactics evolved, but it’s still generally lower-scoring than the Premier League. Over-under lines should reflect this, and when they don’t, value emerges. The quality gap between elite Spanish teams and mid-to-low table sides is enormous, leading to some lopsided results when motivation aligns.
Serie A built its reputation on defensive solidity, and while modern Italian football is more attacking than its historical stereotype, tactical discipline remains emphasized. Matches are often cagey affairs where teams are difficult to break down and capitalize ruthlessly on opponent mistakes. The league produces lower-scoring matches than the Premier League but higher-quality defensive performances.
Italian football’s focus on not conceding makes under bets more reliable than in attacking-focused leagues. First-half unders specifically offer value because teams often feel each other out before opening up. The top teams are typically excellent both offensively and defensively rather than attack-focused with defensive holes.
The Bundesliga is attack-centric with less emphasis on defensive structure than other top European leagues. This produces the highest-scoring matches of major leagues and the most predictable overs. Teams outside the elite struggle defensively while maintaining attacking ambition, creating opportunities for goal-heavy matches.
German football’s high-scoring nature means over-under lines are typically higher than in other leagues. The value comes from identifying the rare defensive battles rather than betting overs generally. Bayern Munich’s dominance is so extreme that their matches often produce lopsided scorelines, making handicap betting more relevant than match winners.
Lower league football offers different opportunities because bookmaker attention decreases while predictable patterns exist. Teams in League One or League Two might have exploitable home-away splits, consistent tactical approaches that create matchup advantages, or financial disparities that manifest in performance more directly than in top leagues.
The challenge in lower leagues is information scarcity. Detailed statistics are harder to find, squad news is less reliable, and unexpected factors like non-payment of wages or ownership chaos influence results unpredictably. The edges exist but require different research methods than top-league betting.
To refine your approach, it is essential to apply statistical methods for bet predictions when evaluating league data.
Live Betting Adjustments for Football

In-play football betting creates unique opportunities because odds update constantly as match events unfold, and those updates often overreact to short-term variance or underweight information that informed observers recognize. The challenge is disciplined execution rather than betting just because you’re watching.
Pre-match preparation determines live betting success. Know what to look for before kickoff which team tends to dominate early, how each team responds to conceding, what tactical adjustments managers typically make. This preparation lets you recognize meaningful patterns rather than reacting to random variance.
The first fifteen minutes often create overreactions in live odds. A team dominates early possession and has two half-chances, and their odds drop significantly despite nothing conclusive happening. If your pre-match analysis suggested that team was overvalued, this movement might create value on their opponent whose odds have drifted despite no fundamental change in match dynamics.
Conceding first doesn’t mean a team will lose, yet odds shift dramatically after the first goal. Strong teams that concede early often equalize eventually, particularly at home. If a team concedes against the run of play perhaps through a defensive error rather than sustained opponent pressure their odds might drift beyond fair value. The market overweights the goal itself versus the underlying match flow.
Score effects change how teams play in predictable ways. The team ahead often becomes more conservative, protecting their lead rather than pushing for more goals. This creates space for the trailing team to attack and potentially generates higher xG for them despite being behind. Understanding these dynamics identifies value on goals markets in-play a match that’s 1-0 might have more goal potential in the remaining time than the pre-match projection suggested.
Red cards are the most dramatic in-play events and create immediate odds swings. A team reduced to ten men for sixty minutes faces massive disadvantage, yet the market sometimes overreacts. If the red card comes when the match is already 2-0 and the team ahead was dominating, the additional goal possibilities might be overstated. Conversely, a red card at 0-0 might not prevent the stronger team from still winning against weaker opposition.
Substitution patterns provide information about managerial intentions. Bringing on attacking players when trailing signals desperation and creates counterattack vulnerability. Defensive substitutions when ahead indicate the manager is prioritizing securing the result over additional goals. These patterns help predict whether late goals are likely and which team might score them.
The psychological trap in live betting is action bias betting because you’re watching rather than because value exists. Most matches don’t present obvious live betting opportunities. The disciplined approach is watching prepared to act on specific scenarios you identified pre-match while otherwise doing nothing. Betting live just for excitement converts what could be profitable analysis into entertainment spending.
Timing matters critically in live betting because odds update quickly. The window where value exists might last seconds, particularly after major events like goals or red cards. Having accounts at multiple bookmakers lets you act fast when you identify opportunities before the market fully corrects.
The mental challenge is accepting that live betting means missing opportunities because you weren’t quick enough or weren’t watching that match. This fear of missing out causes undisciplined betting where you force action to avoid feeling like you missed value. The counter is remembering that opportunities constantly emerge across thousands of football matches weekly. Missing one specific opportunity costs nothing if your overall process remains sound.
Our primary goal is to provide accurate sports predictions for bettors looking to increase their ROI.
